Ballistic Evaluation Motor test 2

The previous tests with the Ballistic Evaluation Motor (BEM) failed because the motor failed to ignite. To avoid ignition problems it was decided to increase the throat diameter from 2 or 3mm to 6mm. This allows the use of a beefier igniter. Pol machined a new insert for the throat region, and made a hollow brass tube with flange for the ignition, in which the igniter was glued in such a way that the head of the igniter protrudes from the underside of the tube.
The length of the tube is designed so that the igniter touches the ignition powder on the surface of the fuel grain when the igniter tube is fully inserted into the motor and resting with its flange on the throat exit. The flange ensure that the entire ignition assembly is expelled from the motor after ignition, so that no parts of the igniter can clog the nozzle.
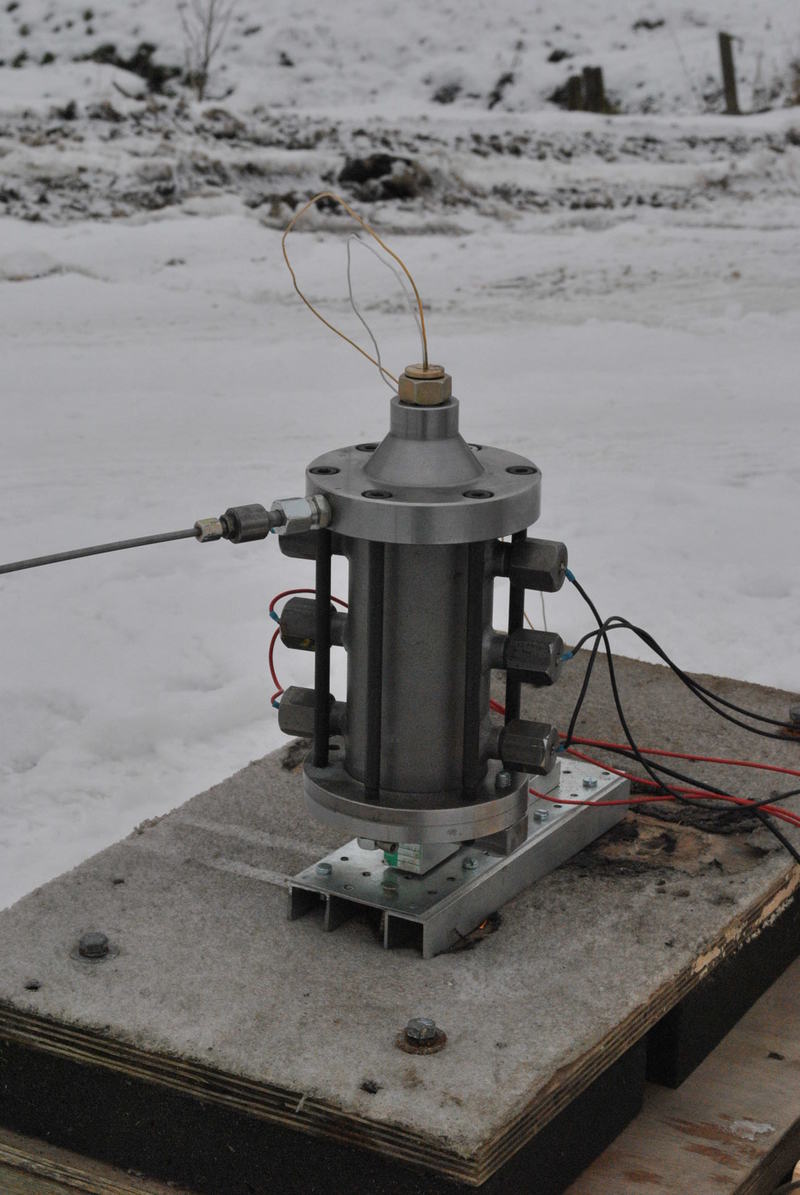 Photo: BEM ready for ignition. The igniter assembly is resting on the nozzle exit with its flange. Also visible are the 6 connections for the break wires and the pressure transducer hook-up (left).
Preparations
A fuel grain was installed inside the BEM, consisting of Potassium-Nitrate/Sorbitol (65/35) propellant poured inside a phenolic sleeve, which was fitted with 3 break wires (0.5mm diameter), running horizontally through the width of the grain. The new throat insert (6mm) was fitted into the nozzle section. The BEM was mounted on top of the load cell, and the entire assembly was screwed to a wood pallet.
The measuring equipment was staged: the Static Test Controller was connected to a laptop, and a terminal program (HyperTerminal) was set to capture the test results to a text file. The load cell, pressure transducer and break wires were connected to the Static Test Controller, and the system was briefly tested to see if everything was correctly connected and functioning. A video camera was mounted on a tripod and positioned some distance from the motor. A microphone was connected to the laptop to record sound measurements (in Audacity).
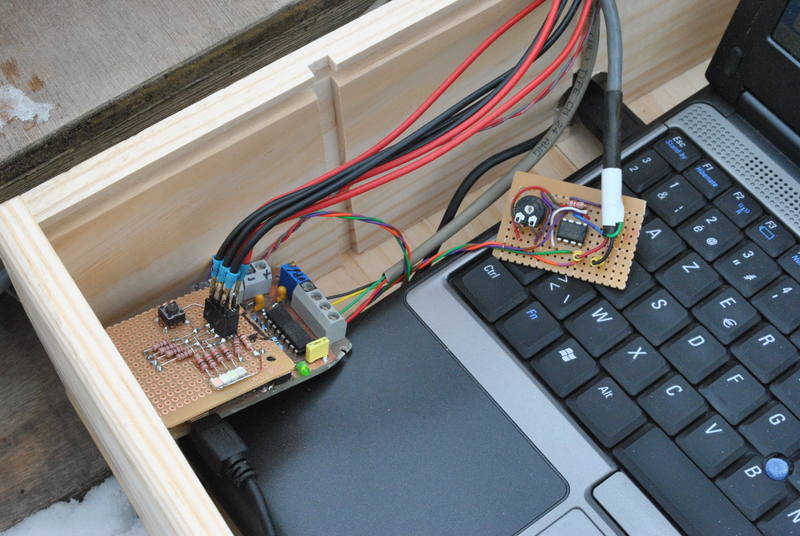 Photo: Static Test Controller with connections for load cell, break wires and pressure transducer (through a separate amplifier).
To ensure positive ignition 10 to 15g of slow burning (home-made) black powder was poured into the throat. This black powder was mixed with some course aluminium powder to increase the ignition temperature. On the burning surface of the motor were a few grams of Zinc-Sulphur powder, a residue of the previous attempt to ignite the motor.
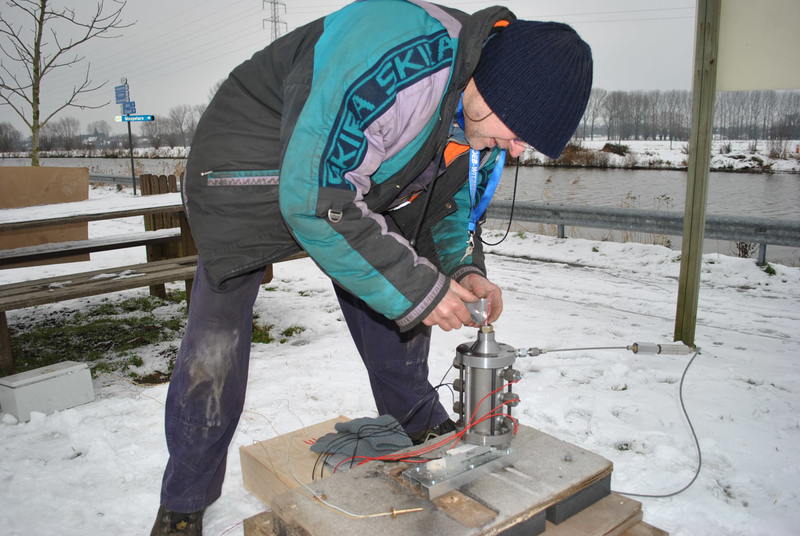 Photo: pouring in the ignition powder
Test and observations
After countdown, Pol pushed the ignition switch. Immediately the yellow flame of the Zinc-Sulphur powder became visible, followed by a thick white exhaust plume that reached a few meter high. The motor burned for around 7 seconds, after which a somewhat black smoke was seen for another 6 seconds. When approaching the motor after around 2 minutes after the end of the burn, the motor was warm to the touch.
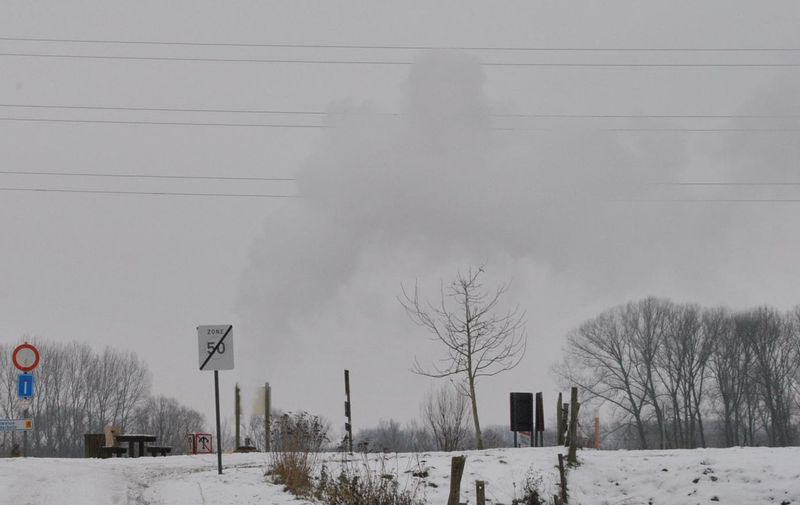 Photo: BEM firing.
Upon first inspection of the motor a discolouring of metal was visible at the outside of the convergent section of the throat region. This discolouring was strangely enough not circular around the complete circumference of the throat, but rather in one spot opposite where the pressure transducer was connected.
The throat showed some deposit of solid decomposition products.
 Photo: throat region after the test
Opening the motor showed the upper seal between the motor tube and upper section to be intact. There was some deposit in the convergence towards the throat, both dispersed as well as locally (in the shape of drops). The phenolic tube in which the propellant had been poured was clearly burned. Clear signs of ablative burning could be seen in the form of blisters. The outside of the phenolic tube showed clear signs of unburned ZnS powder, which has penetrated between the motor and liner on one side of the liner. This indicates a build-up of pressure between the liner and motor wall.
 Photo: inside of convergent region and throat. Visible are the seal with the motor tube, the connection of the pressure transducer and deposits in the throat region.
The contact for the break wires were found to be still shiny on the outside on one side of the liner, lightly soiled with powder and deposits on the other side. The break wires were fully burned through all the way to the walls of the phenolic tube, about 0.5mm was left sticking out of the liner. The polyester bottom of the liner was found intact.
 Photo: phenolic liner after the test. Unburned ZnS ignition powder has been deposited on the outside of the liner. The brass break wire contacts can also be seen.
Analysis
Audio
The audio is badly distorted. This is probably due to the proximity of the microphone to the motor (about 40cm from the throat) and the excessive microphone gain. For previous tests the mic gain must be set to 1/5th of maximum.
The motor has burned for about 6,69 seconds. Since the end of the burn was a gradual tail-down, the end of the burn was not clear and has been estimated. The start-up of the motor was instantaneous, the audio waveform goes immediately to the maximum after ignition and stays there during the majority of the burn phase.
Since the audio was distorted, no signs of oscillation or other exceptional burn behaviour can be seen. In the burn-out phase some oscillations are visible, but whether or not this is related to the burn is not conclusive.
Video
The immediate start-up of the motor can clearly be seen in the video. After the count-down, a yellow flame is immediately seen, followed by a thick white plume that shows that the entire burning surface of the grain has ignited. After ignition the ejection of the igniter assembly can be seen, this is seen flying towards the camera and was found 30cm away from the camera after the test. In the future it might be wise to build a protective box around the camera to avoid damage.
When igniting it is apparent that the motor ‘kicks’ down onto the load cell, which can be seen deflecting and the pressure transducer starts to oscillate. The load cell recovers rather quickly, and does not deflect for another 3 seconds, after which a clear deflection is noticeable, also the pallet on which the assembly is mounted can be seen pushing into the snow. The foam padding in the pallet is seen to compress.
After the motor has burned out, a light black smoke is noticeable, probably coming from the burning phenolic tube and/or polyester bottom. This black smoke lasts for about 50 seconds. No visual changes are seen to the connections to the break wires throughout the test.
Captured data
The following settings were used:
Current config:
- Sample speed: 500 Hz
- Active channels:
	- Loadcell:........... on
	- Pressure transducer: on
	- Breakwires 1,2,3&4:. on
	- Test number: 241
	- Test identification: "VRO BEM test 2"
- Ringbuffer size: 85 samples
The start of the test was triggered by the load cell:
Loadcell triggered test start
The base values were 336 for the load cell, 74 for the pressure transducer and 21 for the break wires.
After the ignition has been detected, the ring buffer is dumped to the terminal (82 samples with value 336 for a buffer size of 85 samples), after which the ignition detection algorithm triggers on the values 336 – 343 – 419 – 595 – 1019). The algorithm looks for a rise of one of the measured values with at least 15 compared to 5 samples ago. This test shows that, after 5 samples, the measured value has already risen with 683. The detection algorithm is probably way too sensitive. Because it was found that the start of test was sometimes triggered by mechanical movement of the motor, it is wise to make the algorithm less sensitive. The test shows that plenty of headroom is available before the algorithm would become unreliable.
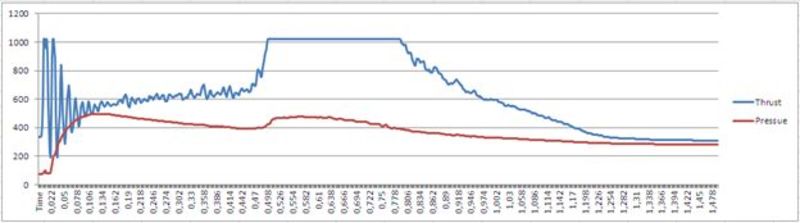
 Graph: Pressure (red) and thrust (blue) during the start-up phase of the motor (1st 134ms)
The graph of the start-up phase (4 to 134 ms after ignition) shows a clear oscillation in the thrust graph. Presumably this is caused by the vibration of the pressure transducers after it was affected by the ignition ‘kick’. This is also consistent with the video, which shows a clear oscillation of the pressure transducer. It was connected to and supported by a smell flexible tube of about 20mm long to the motor, apparently this way of mounting supports or encourages vibration which have a clear effect on the load cell readings. For future tests the pressure transducer connection and mounting need to be changed (flexible connection and rigid mount).
Most certainly the foam layer between the wooden layers of the pallet contributes to the oscillations. The video clearly shows the foam being compressed once the motor comes up to pressure. The use of this pallet with embedded foam layer was ill-fated, and was unfortunately missed during the preparation of the test. In the future the test assembly needs to be mounted as firmly as possible (ideal would be a direct mounting of the load cell on a concrete slab). Fixating the foam layer with wood screws through the upper and lower layer of the pallet would be a quick fix solution.
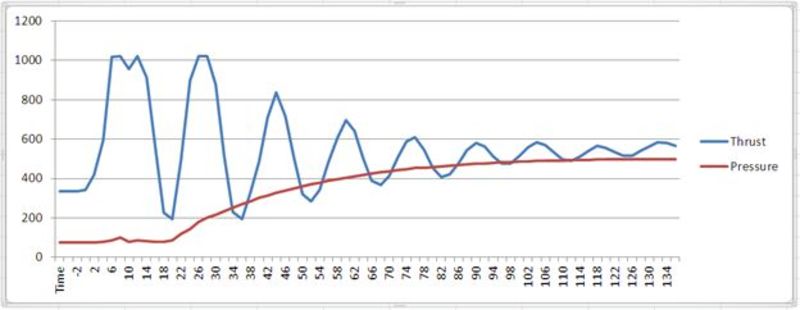
 Graph: Pressure(red) and thrust (blue) during the start of the burn (1st 1,478s)
The full graph of the test shows:
- General:
- The total duration of the test as deducted from the thrust graph (1,478s) does not correspond with the total burn duration as can be seen in the video (>6s). (The above graph only shows the 1st 1,5s of the burn.)
- 3s after ignition the video shows a clear deflection of the load cell, combined with an increase in exhaust gasses. This implies an increased burn rate and thrust, even though this is not visible on the graph. The values of pressure and thrust already start decreasing 0,8s after ignition. The break wires however support this hypothesis. Probably the early decrease in thrust is caused by the dampening effect of the foam layer
- Thrust (blue):
- After ignition and oscillation of the load cell can be seen, which is not consistent with the expected thrust curve, so probably due to an external phenomenon (see above).
- Once stabilised, the thrust rises gradually before suddenly increasing. Maybe this is due to slow ignition, even though this is not consistent with the video. Possibly the motor needs some time to reach a pressure equilibrium.
- The thrust reaches the upper limit of the system. This is presumably caused by setting excessive amplifier gain in the Static Test Controller, possibly combined with the physical contact between two mounting bolts under the motor with the plate the load cell is mounted to. In the future both the correct gain must be set (based on simulations), and the mechanical mount of motor onto the load cell must be changed (more clearance under the load cell).
- The thrust slowly tapers off to its original level. This could signify that the burning surface if not perpendicular but rather conical. A possible cause could be the spot ignition, even though enough ignition powder was poured into the motor to ensure ignition of the whole burning surface. This is subject to further study in future tests.
- The slow taper-off of the thrust can also be due to compression of the foam layer under test assembly, which allows the load cell to spring back to its original shape while the foam layer disperses the thrust.
- Pressure:
- The pressure sensor gradually comes up to pressure, and reaches an equilibrium during the burn.
- After an initial rise the pressure drops slightly, with another small increase in the middle of the burn. Possibly this is due to (minuscule) irregularities in the fuel grain (air bubbles, voids, inclusions) or a partial blockage of the pressure transducer.
- After the burn the pressure does not drop back to its original level (as would be expected), but rather stays the same during at least a few minutes after the burn (start value 74, end value 276). This is possible caused by a (complete) blockage of the pressure transducer connection (less plausible), or by temperature drift due caused by the heating of the transducer’s membrane by the hot combustion gassed. This is to be further investigated. It is however clear that the connection of the pressure transducer to the motor needs to be thoroughly revised.
Break wires:
Graph: Pressure (red), thrust (blue) and break wires during the complete test
In the break wire data a few bizarre phenomena were noticed:
- The first break wire disconnects briefly for 26ms, 360ms after ignition. Afterwards it is continuous again. This is possibly due to the spring-loaded connection of the break wire contacts, which briefly lose contact because of the sudden development of pressure. This needs to be further investigated.
- The break wires break at the following times (and stay broken afterwards)
- BW4: 3,972s
- BW2: 6,592s
- BW3: 6,684s
- The data suggests that the break wires didn’t break in the correct order. It has been checked if they were hooked up correctly (both physically, on the printed circuit board and in the firmware), and found that they were. It needs to be further investigated why they broke out of order.
-
Even though the break wires were embedded at equal distances in the fuel grain, there is a clear difference between the duration of the breaking of the wires. The first wire that breaks (BW4) is only 3,972s after ignition. 2,62s later the next wire breaks, 0,092s later the last one. The duration between the breaking of the different wires was expected to be more or less constant. Possibly the wires do not break when the flame front passes, but rather only after the flame front has already passed and the break wires have been subject to the combustion heat for a while, overcoming the thermal mass of the wire.
- The measured distance between the break wires in the fuel grain are:
- Top surface to first break wire: 18,95mm
- Between 1st and 2nd break wire: 50,1mm
- Between 2nd and 3d break wire: 50mm
- Between 3d break wire and the bottom of the liner: 19,54mm (further to be reduced by the thickness of the bottom of the liner, 5mm?)
Conclusions / improvements
The (makeshift) ignition did its job. In the future a reliable ignition system must be developed that can also be used with small throat sizes.
The mechanical side of the BEM functions fine. The seals hold up to the burn pressure and the phenolic liner has proven to be heat resistant. However the mechanical stability of the spring break wire contacts needs to be further investigated.
The Static Test Controller worked fine. The sensitivity of the start detection algorithm must however be decreased (firmware change). The connections of the load cell and pressure transducers to the Static Test Controller must be made more robust and flexible (use of decent connectors with mechanical latch).
A protective cover must be constructed to protect the camera and laptop from damage caused by the ejection of the ignition assembly or from a possible CATO.
The mechanical mounting of the pressure transducer must be corrected to prevent oscillations.
The hydraulic connection of the pressure transducer needs to be changed to prevent clogging and to avoid the hot combustion gasses from reaching and warming up the membrane (resulting in sensor drift).
The thrust measurement has exceeded the maximum range of the Static Test Controller. In the future the correct gain must be set and calibrated, and the mechanical mount of the load cell must be changed (more clearance).
The measured values for thrust and pressure are not concise with the burn as seen on video (possibly due to the foam padding). This is most unexpected, and it is important to further investigate this since it is critical for the correct functioning of the complete system.